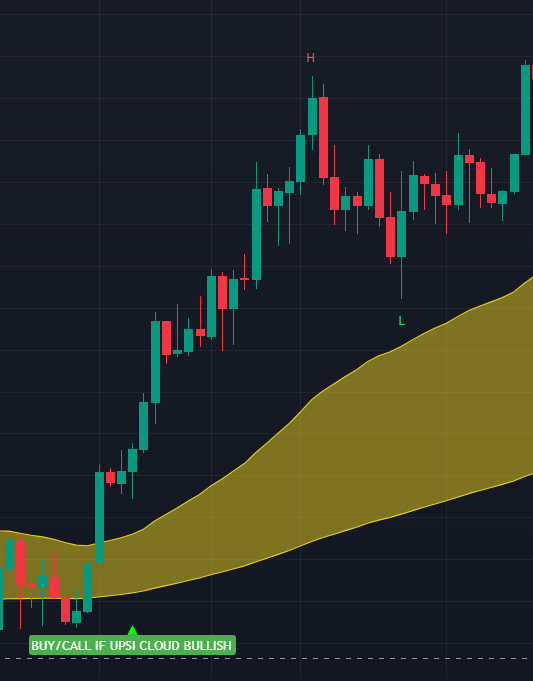
The ultimate trading tool to help you gain an edge in the markets Scalp the Bull & Bear markets like a Pro.

Skyrocket your success and fundamentally change your trading career!

What is ©UPSI ?

©UPSI is a Ultimate Profit Scalping Indicator which was created to remove frustration when analyzing markets. We found that too many inexperienced traders where cluttering their charts with countless indicators, resulting in confusion when analyzing price action. ©UPSI provides simple, easy to use ALL-IN-ONE indicator that will provide you with unbiased buy and sell opportunities on all assets and all timeframes.

Why use ©UPSI Indicator?

Do you often feel that market goes against you after you place a trade? Have you been waiting for a chance to change your way of trading? Reduce unnecessary losses and increase your odds of winning with this one easy tool.

More Winning Trades

The tools included in the ©UPSI indicator will certainly help you build a foundation in your trading strategy as well as increase your potential profits.

All Markets, All Timeframes

©UPSI works in every market and every timeframe. Perfect for day traders, swing traders and scalpers!

Easy To Use

Anyone can easily use ©UPSI, whether you're a beginner trader or an experienced trader, our tools will help you enhance your trading performance.

On any device across all markets.

Stocks - Commodities - Forex-Crypto

What Will You Get?

Here Are The Core Features:

01

©UPSI Trend Component: BUY/SELL signals provider

Provides buy & sell signals. This works best when combined with the UPSI trend cloud. Always know when to go LONG and when to go SHORT.

02

©UPSI Trend Cloud

Helps to identify long term & short term trends in the market. Remember: Trend is your friend! It will also help you to identify support and resistance points in the trending and ranging markets.

03

©UPSI Volume Profile Indicator

©UPSI Volume Profile is vital to analyse at the end of parabolic moves. By analysisng the trends of previous volume indicator results, you can focus on the price movements and take the call for buying OR selling based on the market trend, and make necessary correction when needed. UPSI-Volume element indicates the strength of any trend or its weakness.


04

©UPSI Support & Resistance Market Spotter

©UPSI Support & Resistance Market Spotter. This will automatically display the exact support & resistance levels and the exact support & resistance price points on all time frames. Yes, that is right, on all time frames. This element will also show you swing low & swing high price zones helping you find the best Take Profit & Stop Loss levels.

05

SUPPORT & RESISTANCE SCALPER

If the price falls below a support level, that level will become resistance. If the price rises above a resistance level, it will often become support. As the price moves past a level of support or resistance, it is thought that supply and demand has shifted, causing the breached level to reverse its role. What if there was indicator that will show support & resistance exact price points and price levels? Check this out!

+ FREE BONUS

BONUS 1

©UPSI One-Click AUTO FIBONACCI

This indicator automatically plots a Fibonacci retracement based on the number of bars you select. The Fibonacci is automatically updated in real time as new highest and lowest values appears amongst the selected bars. Set Fibonacci like a Pro even if you never used Fibonacci before. 

BONUS 2

©UPSI Automatic Triangle, Wedge & Flag Spotter

Wedge , triangle and flag patterns are commonly used by technical traders to identify potential trend reversals or continuation in the markets. A wedge pattern is characterized by two converging trendlines that form a wedge shape on a price chart. This pattern can be either bullish or bearish, depending on the direction of the trendlines and the overall trend. A bullish wedge pattern is typically seen as a continuation pattern, while a bearish wedge pattern is typically seen as a reversal pattern.

©UPSI Verified Track Record

Check Out The Profits Our Community Has Been Making

Faq

You need a computer PC, or smartphone, or Tablet with an Internet connection and FREE tradingview.com account.
You can use ™UPSI on all timeframes, best being 1H, 4H and 1D
All pairs. Forex, Stocks, Cryptocurrencies, Commodities and most CFDs.
www.tradingview.com (use FREE or paid account; paid account is NOT required)
Instant Download. No waiting.
It is a Powerful Indicator that will show you when to enter and exit your trades.
Yes. You can run on a demo account for as long as you like until you see that it is making you consistent profits, then you can switch to a real account.
You can start with as little as $100 with some brokers. For broker recommendations you can contact us: [email protected]
Yes, we provide full support for ™UPSI, money management strategy, technical queries and general trading support.
Price is $97 per month. You can cancel subscription anytime.
Feel free to contact me anytime with any questions you might have: [email protected] OR [email protected]