Using Moving Averages – The Basics
When it comes to popular and useful tools for trading, moving averages are some of the widely used indicators out there. Yet, although moving averages can tell you a whole lot and allow for good trade setups, and although they can be easy to use, you do really have to know what you are doing.
Using moving averages for trading is not all that difficult, but if you don’t use them right, they can lead to making big time mistakes that can end up costing you a whole lot of money.
Today, we want to take you on a tutorial on using moving averages. We want to discuss how to choose the best timeframes for your moving averages, how to choose the right type for your trading setup, and how to use them too. There are 3 ways of using moving averages that we want to go over for your benefit, so let’s get right to it.
Part 1: Using Moving Averages – SMA or EMA?
One thing that you need to know is that there are two main types of moving averages that you could be using. The first is the SMA or simple moving average, and the second is the EMA or the exponential moving average.
When traders first start out, knowing the difference between these two is crucial, and it’s because when you trade, you need to use the right one.
Although the difference between the simple moving average and the exponential moving average is not huge, quite subtle in fact, not knowing the difference can lead to errors and mistakes that can end up costing you money.
SMA vs EMA – The Difference
There is one main difference between simple moving averages and exponential moving averages. This difference has to do with speed. EMAs are much faster in their response to changing market conditions, and this means that it changes directions much faster than the SMA.
EMAs place the top priority and the most weight on the most recent price changes. In other words, the EMA responds very quickly to price changes, but the SMA takes longer to respond, thus making EMAs more effective for many trading setups.
That said, there is technically no better or worse between these two. Yes, the EMA reacts to recent price changes much faster, but in some cases, this can lead to it producing early signals that are false. If the signals are too early, your trades won’t pan out.
Now, although the SMA moves a lot slower than the EMA, it does have the advantage of being able to keep you in profitable positions for longer due to its ability to cancel out some market noise. It is not as largely affected by erratic market behaviors as the EMA. Yet, the SMA takes longer to get you into trades than the EMA. It’s quite the trade off to think about.
/SMA-5c535f2846e0fb00012b9825.png)
Part 2: MAs & Timeframes
After you decide on the type of moving average you want to use, the next thing that needs doing it to choose the period or the timeframe. First, you need to know why you are moving averages, and you then also need to figure out if you are a day trader or a swing trader. Let’s explain.
Using the Popular Moving Averages
Most people will tell you that these averages work because they are self-fulfilling prophecies. In other words, price action goes hand in hand with moving averages because so many traders use them. The point here is that you need to stick to the most popular and commonly used indicators/. Going with the herd and using the most popular ones will increase your chances of success.
Moving Averages for Day Trading
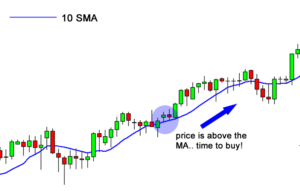
If you are a short term day trader, you need to use moving averages with fast response times, ones that react to changing markets very quickly. There are 3 periods you should consider if you are day trading. First, 9 or 10 period MAs are super responsive and fast moving. Second, the 21 period MAs are the most accurate. Third, 50 period MAs are best for identifying long term trends.

Moving Averages for Swing Trading
Swing traders generally use longer timeframes and they hold onto positions for longer too. Therefore, swing traders should use an SMA with a longer period in order to avoid false and early signals. For swing trading, the 20/21 period tends to be best as price respects it very well.
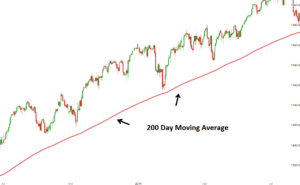
The 50 period is the standard for swing trading as it is a good midground between too short and too long. The 100 period MA works very well for traders who also use support and resistance. The 200 and 250 periods are great for long terms traders.

Part 3: Using Moving Averages – How To
You now know the difference between EMA and SMA, and you know about the time periods too. Let’s go over a few examples of using moving averages in a practical application.
Trend Direction
Many traders use MAs to identify trends in the market and the direction of those trends. A fast responding exponential moving average is a great way to filter out trades and to stay on the profitable side of the market. Trading by following trend directions turns out to be a very successful trading methodology for many.
Golden Cross & Death Cross
Moving averages can also be used as directional filters. The Golden Cross and Death Cross is a signal that occurs when the 50 period and 200 period moving averages cross one another. These are seen mostly on daily charts. Simply put, when the 50 period crosses below the 200 period, you would enter a short trade. When the 50 crosses below the 200, you would enter long. This helps identify market direction.
:max_bytes(150000):strip_icc()/GoldenCross-5c6592b646e0fb0001a91e29.png)
Support & Resistance
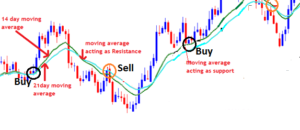
MAs can also assist you if you are trading with support and resistance, as well as stop loss placement too. MAs work great as support and resistance levels. The only thing to take note of here is that moving averages cannot be used in ranging markets.
If prices are ranging back and forth between S & P, the MA will be in the middle of that range, and the price won’t really respect it. Moving averages tend to lose all of their credibility and validity in ranging markets.

Bollinger Bands
Bollinger Bands is a type of technical indicator that is based on moving averages. In the middle of the bands, you can find the 20 period MA, with the outer bands measuring volatility. Yes, in a ranging market, the price will move around the MA, but the bands are still important.
If the price touches the outer bands within a range, it can signal a price reversal in the other direction. While moving averages lose validity in ranging markets, BB can still help to analyze price.
When there is a trend, Bollinger bands allow you to stay in trades. When a trend is strong, price will move away from the MA and towards the outer bands. If the price breaks the MA again, a change in direction is signalled. If you see an outer band being violated, it often indicates that a retracement is in the works.

Conclusion
The bottom line is that MAs come in many shapes, you can use them with many periods, and they can be used in combination with many other tools to enter and exit trades the right way. For more information on everything you need to know about trading, check out some of our price action trading strategies.
